Season Summary
The 2023-2024 season for DCA Dhahran Cricket Association was marked by exceptional performances, both individually and collectively. Over the season, DCA Stars and DCA Challengers were particularly notable, with DCA Stars winning both the Champions Trophy and Invitational tournaments. Individual performances were highlighted by Umar Iftikhar, who scored a remarkable 2659 runs, and Saad Yousaf, who led the wicket-takers with 60 wickets. For comprehensive statistics, visit the overall stats page.
Fielding and wicket-keeping were equally impressive. Saad Yousaf stood out with 45 catches, while Junaid Jan led with 38 dismissals. The season also saw Syed Dabeer excelling with 9 runouts. These contributions were critical to their teams’ successes, showcasing the importance of a strong fielding unit.
Leadership played a crucial role, with captains like Rehan Khan achieving an 84.62% win rate and Avais Qureshi leading his team to 22 victories. For more detailed statistics and comprehensive data on all players and teams, visit the main stats website. This season’s performances underscore the high level of competition and skill within the DCA.
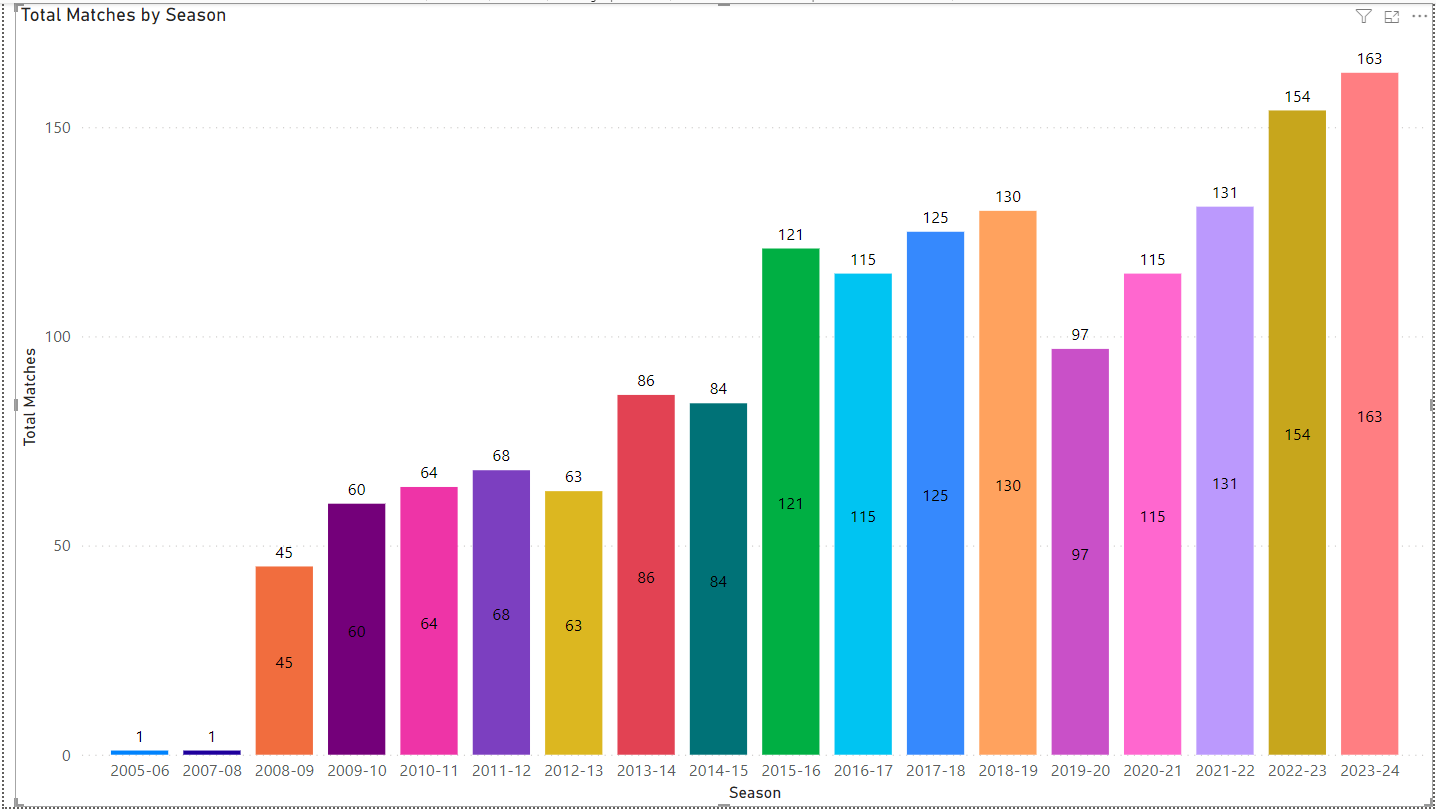
This season has been an exciting and eventful one for Dhahran Cricket Association. With a total of 163 matches played across various categories and tournaments, the six teams under DCA showcased their talents and competitive spirit. This shows the growth of number of matches that DCA has been playing over the number of years.
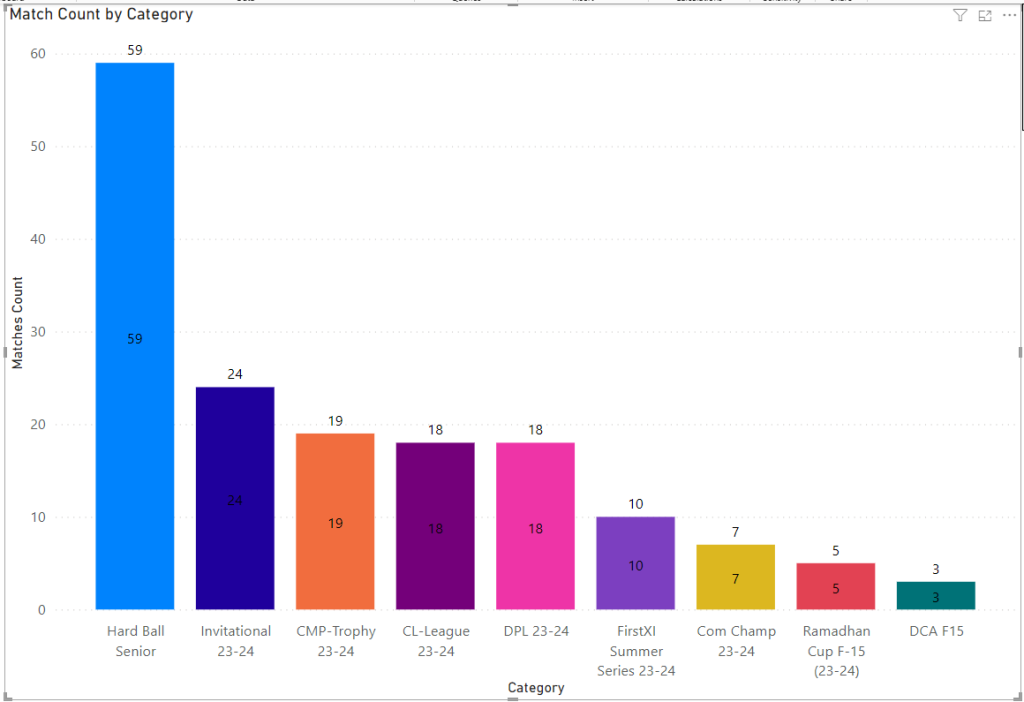
The season witnessed a diverse range of matches:
- Hard Ball Senior: The most prominent category with 59 matches.
- Invitational 23-24: Featuring 24 matches.
- CMP-Trophy 23-24: With 19 matches.
- CL-League 23-24 and DPL 23-24: Each hosting 18 matches.
- FirstXI Summer Series 23-24: Including 10 matches.
- Com Champ 23-24: Featuring 7 matches.
- Ramadhan Cup F-15 (23-24): With 5 matches. (Not included in T20 Stats)
- DCA F15: Consisting of 3 matches (Not included in T20 Stats).
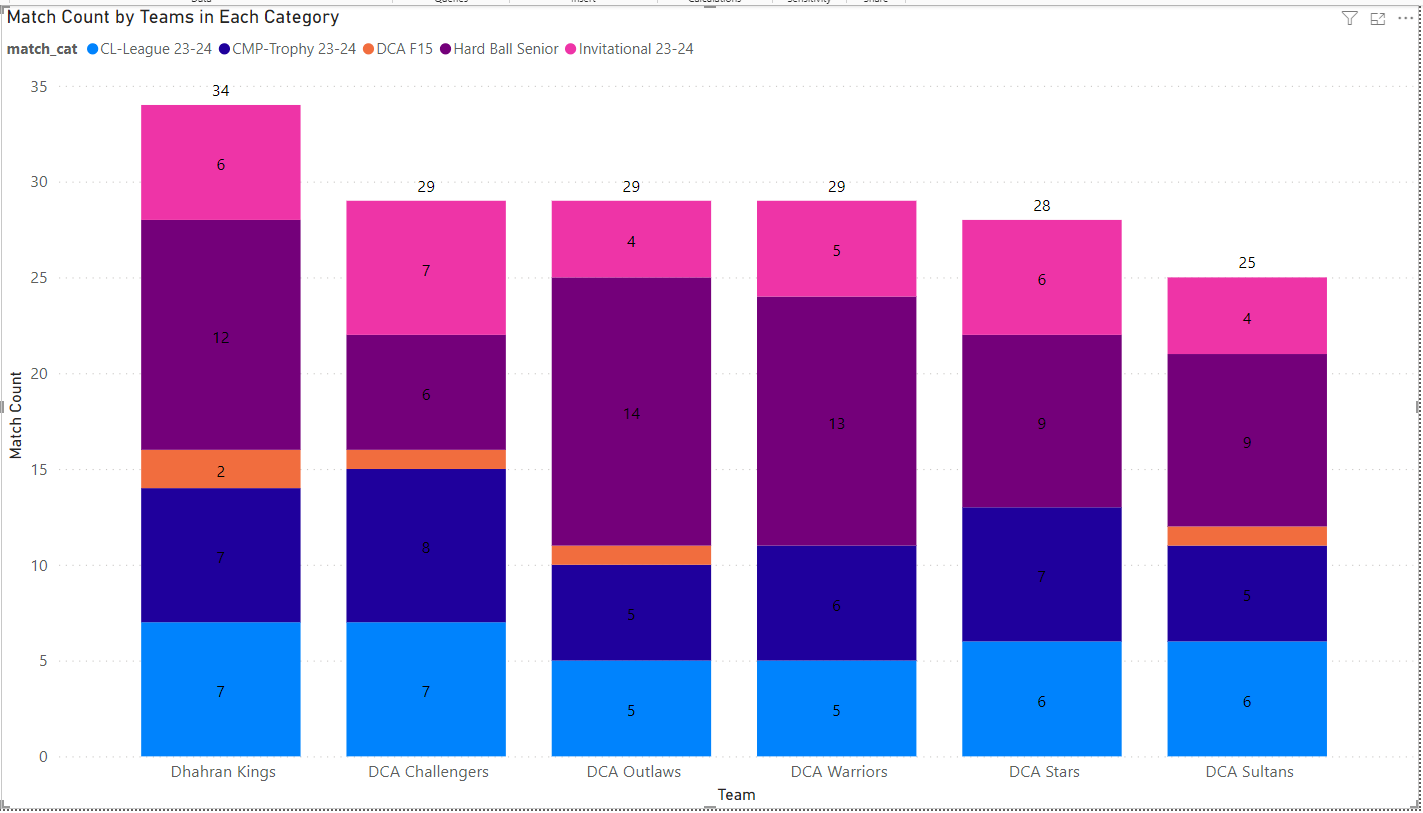
The detailed breakdown of matches played by each team is as follows:
- Dhahran Kings: Played 34 matches, with strong participation across all categories.
- DCA Challengers: Played 29 matches, showing notable performances in various tournaments.
- DCA Outlaws: Also played 29 matches, displaying consistency and competitiveness.
- DCA Warriors: Participated in 29 matches, with balanced contributions in all categories.
- DCA Stars: Played 28 matches, highlighting their strategic play in key tournaments.
- DCA Sultans: Played 25 matches, with a focus on Invitational and Hard Ball Senior categories.
The overall growth in the number of matches each season reflects the increasing enthusiasm and dedication of our players, coaches, and support staff. This season’s performance sets a high bar for the coming years, and we look forward to building on this success.
Let’s celebrate the hard work, teamwork, and remarkable performances of all our teams and players who made this season memorable!
Key Highlights and Achievements
This season has been filled with remarkable achievements and memorable moments for DCA Dhahran Cricket Association. Here are some of the key highlights:
- DCA Stars dominated the season, starting with a victory in the CMP-Trophy 23-24 on October 21, 2023. In a thrilling final, DCA Stars chased down 132 runs, defeating DCA Challengers by 3 wickets. This win set the tone for their outstanding season. Match Summary
- Dhahran Dheeb claimed the DPL 23-24 title on December 8, 2023. In a low-scoring final. They chased a total of 98 runs, winning by 4 wickets against Dhahran Flames. Match Summary
- DCA Challengers showcased their prowess by winning the CL-League 23-24 on February 10, 2024. They posted a formidable total of 215 runs and secured an impressive 81-run victory over Dhahran Kings. Match Summary
- The most prestigious tournament, the Invitational 23-24, concluded with an epic final on June 7, 2024. DCA Stars triumphed once again, narrowly defeating DCA Challengers by 3 runs in a nail-biting finish. This victory marked a perfect end to their remarkable season, solidifying their reputation as the top team in the league. Match Summary
These victories not only highlight the competitive spirit of our teams but also the dedication and hard work put in by each player. The season’s achievements are a testament to the strategic brilliance and consistent performances across all tournaments, making this a season to remember for DCA Dhahran Cricket Association.
Top Batting Performances
The batting performances this season have been outstanding, with several players showcasing their skills and contributing significantly to their teams. Here’s a summary of the top performers:
- Iftikhar Umar: A standout performer, Iftikhar played 48 matches, scoring an impressive 2659 runs with a highest score of 176*. His average of 83.09 and strike rate of 191.29 are remarkable, with 6 centuries and 17 fifties to his name. He also hit 183 fours and 155 sixes. His 2659 runs are highest ever in any season in DCA history.
- Avais Qureshi: Avais played 54 matches and scored 1698 runs, including a highest score of 103. With an average of 33.29 and a strike rate of 171.52, he has been a consistent performer, hitting 142 fours and 111 sixes.
- Rehan Khan: Rehan’s 1566 runs from 45 matches, with a highest score of 123*, underline his importance. He averaged 47.45 with a strike rate of 163.64, including 2 centuries and 11 fifties, and hit 122 fours and 84 sixes.
- Daniyal Fahim: With 1515 runs from 50 matches, Daniyal showcased his prowess with a highest score of 124. His average of 42.08 and strike rate of 154.59, including 1 century and 10 fifties, are commendable. He hit 92 fours and 75 sixes.
- Atif Nisar: Atif scored 1272 runs in 42 matches, with a highest score of 89*. His average of 41.03 and strike rate of 164.77, along with 11 fifties, highlight his consistency. He hit 47 fours and 92 sixes.
- Waqas Hasan: Waqas accumulated 1197 runs from 46 matches, with a highest score of 88. Averaging 32.35 and a strike rate of 132.41, he hit 62 fours and 81 sixes, with 10 fifties.
- Faisal Bashir: Faisal scored 1154 runs in 35 matches, with a highest score of 101. His average of 37.23 and strike rate of 155.95, including 1 century and 8 fifties, are impressive. He hit 95 fours and 60 sixes.
- Asim Hussain Shah: Asim accumulated 1009 runs in 31 matches, with a highest score of 91*. His average of 33.63 and strike rate of 132.76, including 9 fifties, underline his importance. He hit 60 fours and 45 sixes.
These top players have demonstrated exceptional skill and consistency throughout the season, making significant contributions to their teams’ successes. For a detailed report on all the top run-scorers and their statistics, please visit the full report.
Top Bowling Performances
This season has seen some stellar bowling performances, with players delivering exceptional spells and leading their teams to victory. Here are the highlights of the top bowlers:
- Saad Yousaf: Saad has been a formidable force on the field, playing 47 matches and taking 60 wickets. His best bowling figures of 4-11 and an average of 17.87 reflect his consistency and skill. With an economy rate of 6.46 and a strike rate of 16.60, Saad has been a crucial asset to his team, contributing significantly with his disciplined bowling. His 60 wickets are highest in any season in DCA history.
- Syed Sarfaraz Alam: Syed has impressed with his 47 wickets in 36 matches. His best figures of 4-10 and an average of 16.47 highlight his effectiveness. With an economy rate of 6.10 and a strike rate of 16.19, he has been a reliable bowler, often breaking crucial partnerships and maintaining pressure on the opposition.
- Mohammad Atif: Mohammad has been another standout performer, taking 44 wickets in 35 matches. His best figures of 4-11 and an average of 18.66 demonstrate his impact. With an economy rate of 7.86 and a strike rate of 14.25, Mohammad has been pivotal in key moments, delivering match-winning performances.
- Ali Abbas: Ali has been consistent throughout the season, claiming 44 wickets in 45 matches. His best bowling of 4-19 and an average of 24.89 show his value. With an economy rate of 7.68 and a strike rate of 19.43, Ali has played a vital role in restricting the opposition’s scoring.
- Hassan Iqbal: Hassan has also been impressive, taking 44 wickets in 45 matches. His best figures of 4-17 and an average of 25.68, along with an economy rate of 7.04, highlight his ability to control the game. His strike rate of 21.89 shows his knack for taking wickets at crucial times.
These bowlers have showcased exceptional skill and dedication, making significant contributions to their teams’ successes. For a detailed report on all the top wicket-takers and their statistics, please visit the full report.
Top Wicket Keeping Performances
This season has seen some exceptional wicket-keeping performances, with players demonstrating agility, quick reflexes, and sharp awareness behind the stumps. Here are the highlights of the top wicket-keepers:
- Junaid Jan: Junaid has been a standout wicket-keeper, playing 32 matches and contributing significantly with 13 catches and 25 stumpings, totaling 38 dismissals. His skillful keeping has been crucial in turning matches in favor of his team.
- Abdullah Bawazir: Abdullah showcased his wicket-keeping prowess in 37 matches, with 11 catches and 19 stumpings, totaling 30 dismissals. His consistent performance behind the stumps has been a valuable asset for his team.
- Murali Nagarajan: Murali has been impressive with his 21 catches and 8 stumpings in 37 matches, totaling 29 dismissals. His quick reflexes and sharpness have made him a key player in the field.
- Salman Kaleemi: Salman demonstrated his keeping skills in 34 matches, with 18 catches and 7 stumpings, totaling 25 dismissals. His ability to stay alert and react quickly has been commendable.
- Munzir Hasan: Munzir has been a reliable wicket-keeper, playing 24 matches and securing 15 catches and 9 stumpings, totaling 24 dismissals. His performance has been crucial in several close matches.
These wicket-keepers have shown exceptional skill and dedication, making significant contributions to their teams’ successes. For a detailed report on all the top wicket-keepers and their statistics, please visit the full report.
Top Fielding Performances
Fielding is a critical aspect of cricket, often turning the tide of matches with exceptional catches, stumpings, and runouts. The top fielding performers for this season have shown remarkable skill and consistency.
Top Catchers:
- Saad Yousaf led the charts with 45 catches in 47 matches, showcasing exceptional reflexes and positioning.
- Umar Iftikhar secured 33 catches in 48 matches, contributing significantly to the team’s defense.
- Avais Qureshi and Saeed Ahmed also displayed commendable performance with 27 and 22 catches respectively.
Runouts:
- Syed Dabeer was outstanding with 9 runouts in 36 matches, demonstrating excellent field awareness and agility.
- Muhammad Asif, Ammad Ahmed, Daniyal Fahim, Ahmad Yafai, Abdullah Bawazir, and Saad Yousaf each achieved 5 runouts, significantly contributing to their teams’ defensive efforts.
Top Keepers:
- Junaid Jan led with 38 dismissals (13 catches, 25 stumpings, 3 runouts) in 32 matches, showcasing excellent wicket-keeping skills.
- Abdullah Bawazir followed with 30 dismissals (11 catches, 19 stumpings, 5 runouts) in 37 matches.
- Murali Nagarajan achieved 29 dismissals (21 catches, 8 stumpings, 4 runouts) in 37 matches.
- Salman Kaleemi and Munzir Hasan also performed notably with 25 and 24 dismissals respectively.
Team Performance
Here is the team performance data in a tabular format, sorted by win percentage:
| Team | Matches Played | Wins | Losses | Draws | Win Percentage | Runs | Wickets Taken |
|---|---|---|---|---|---|---|---|
| DCA Stars | 28 | 21 | 7 | 0 | 75.00% | 4513 | 205 |
| Dhahran Kings | 32 | 22 | 10 | 0 | 68.75% | 5403 | 196 |
| DCA Challengers | 28 | 19 | 9 | 0 | 67.86% | 5031 | 198 |
| DCA Sultans | 24 | 8 | 15 | 1 | 33.33% | 3801 | 137 |
| DCA Warriors | 29 | 8 | 20 | 1 | 27.59% | 4701 | 171 |
| DCA Outlaws | 28 | 3 | 25 | 0 | 10.71% | 3898 | 174 |
This season, the six permanent teams of the DCA Dhahran Cricket Association showcased a wide range of performances across various tournaments.
- DCA Stars emerged as the top team with an impressive win percentage of 75.00%. They played 28 matches, winning 21 and losing 7, scoring 4513 runs and taking 205 wickets.
- Dhahran Kings also had a strong season with a win percentage of 68.75%, winning 22 out of 32 matches. They were consistent in both batting and bowling, scoring 5403 runs and taking 196 wickets.
- DCA Challengers maintained a solid performance with a win percentage of 67.86%, winning 19 out of 28 matches. They scored 5031 runs and took 198 wickets.
- DCA Sultans had a mixed season with a win percentage of 33.33%, winning 8 out of 24 matches. They scored 3801 runs and took 137 wickets.
- DCA Warriors faced a tough season, managing a win percentage of 27.59% with 8 wins out of 29 matches. They scored 4701 runs and took 171 wickets.
- DCA Outlaws struggled this season with a win percentage of 10.71%, winning only 3 out of 28 matches. They scored 3898 runs and took 174 wickets.
These performances reflect the diverse competitive spirit and capabilities of the teams within the DCA Dhahran Cricket Association. For more detailed statistics and match summaries, please visit the full report.
Finals Performances
| Team | Total Finals | Finals Won | Runner-up Finishes | Tournaments Played | Finals Reached % | Win Percentage |
|---|---|---|---|---|---|---|
| DCA Stars | 2 | 2 | 0 | 3 | 66.67% | 100.00% |
| DCA Challengers | 3 | 1 | 2 | 3 | 100.00% | 33.33% |
| Dhahran Kings | 1 | 0 | 1 | 3 | 33.33% | 0.00% |
| DCA Sultans | 0 | 0 | 0 | 3 | 0.00% | 0% |
| DCA Outlaws | 0 | 0 | 0 | 3 | 0.00% | 0% |
| DCA Warriors | 0 | 0 | 0 | 3 | 0.00% | 0% |
Throughout the season, the teams participated in many tournaments, showcasing their competitive edge. DCA Stars played in 2 finals, winning both, with a 100% success rate in finals. DCA Challengers reached 3 finals, winning 1 and finishing as runner-up in 2, showing their consistent performance. Dhahran Kings reached 1 final, finishing as runner-up. For more detailed statistics and match summaries, click on the team names.
Statistical Analysis: Balls Faced vs. Runs Scored
In cricket, analyzing a player’s performance through statistical methods can provide deeper insights into their effectiveness and consistency. One such method is the scatter plot analysis of balls faced versus runs scored. This scatter plot helps visualize the relationship between the number of balls a player has faced and the total runs they have scored throughout the season.
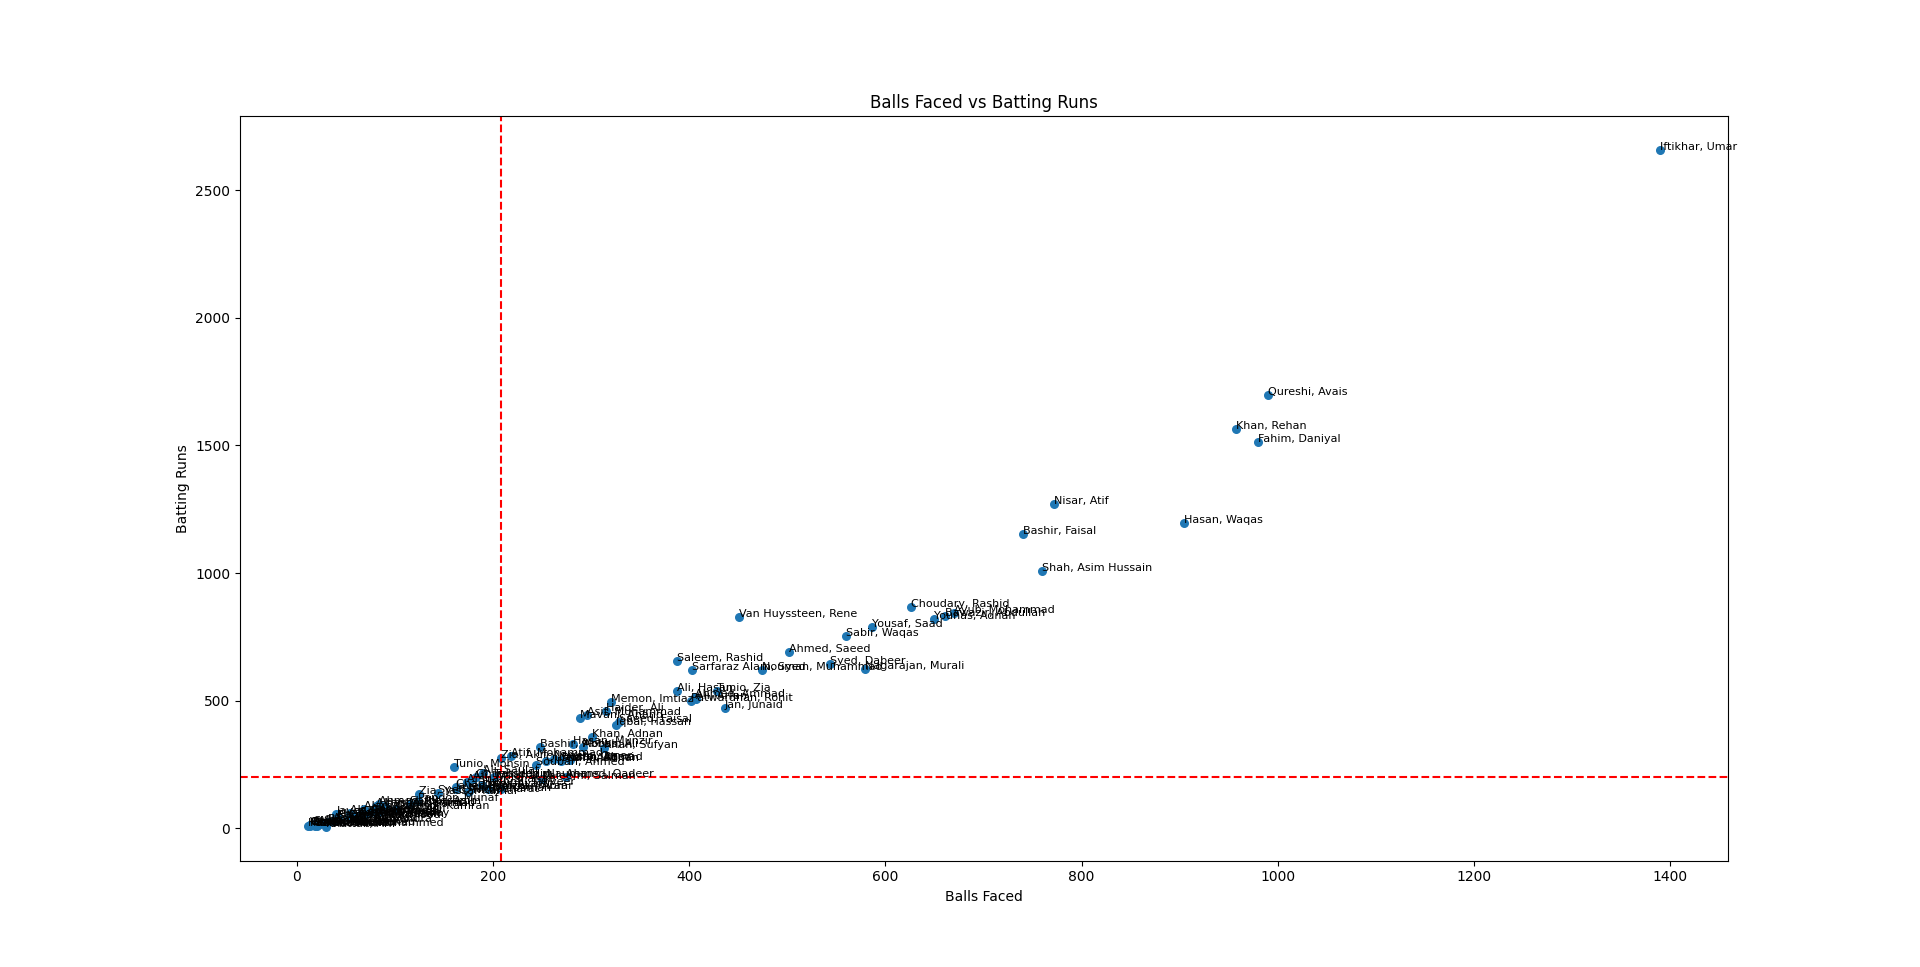
In the attached scatter plot, each dot represents a player’s performance in terms of the total number of balls faced versus the runs scored during the season. Notable observations include:
- High Performers: Players like Iftikhar Umar and Avais Qureshi are positioned at the top right, indicating they have scored a high number of runs while facing many balls, showing both endurance and scoring ability.
- Efficient Scorers: Players with high runs but fewer balls faced are also crucial as they indicate higher efficiency in scoring. For example, Rehan Khan and Daniyal Fahim demonstrate this balance well.
- Consistency: The majority of players fall along a trend line indicating a proportional increase in runs with balls faced, showcasing a balanced approach across the team.
For a detailed look at the players’ performances based on this statistical analysis, click on the attached image of the scatter plot.
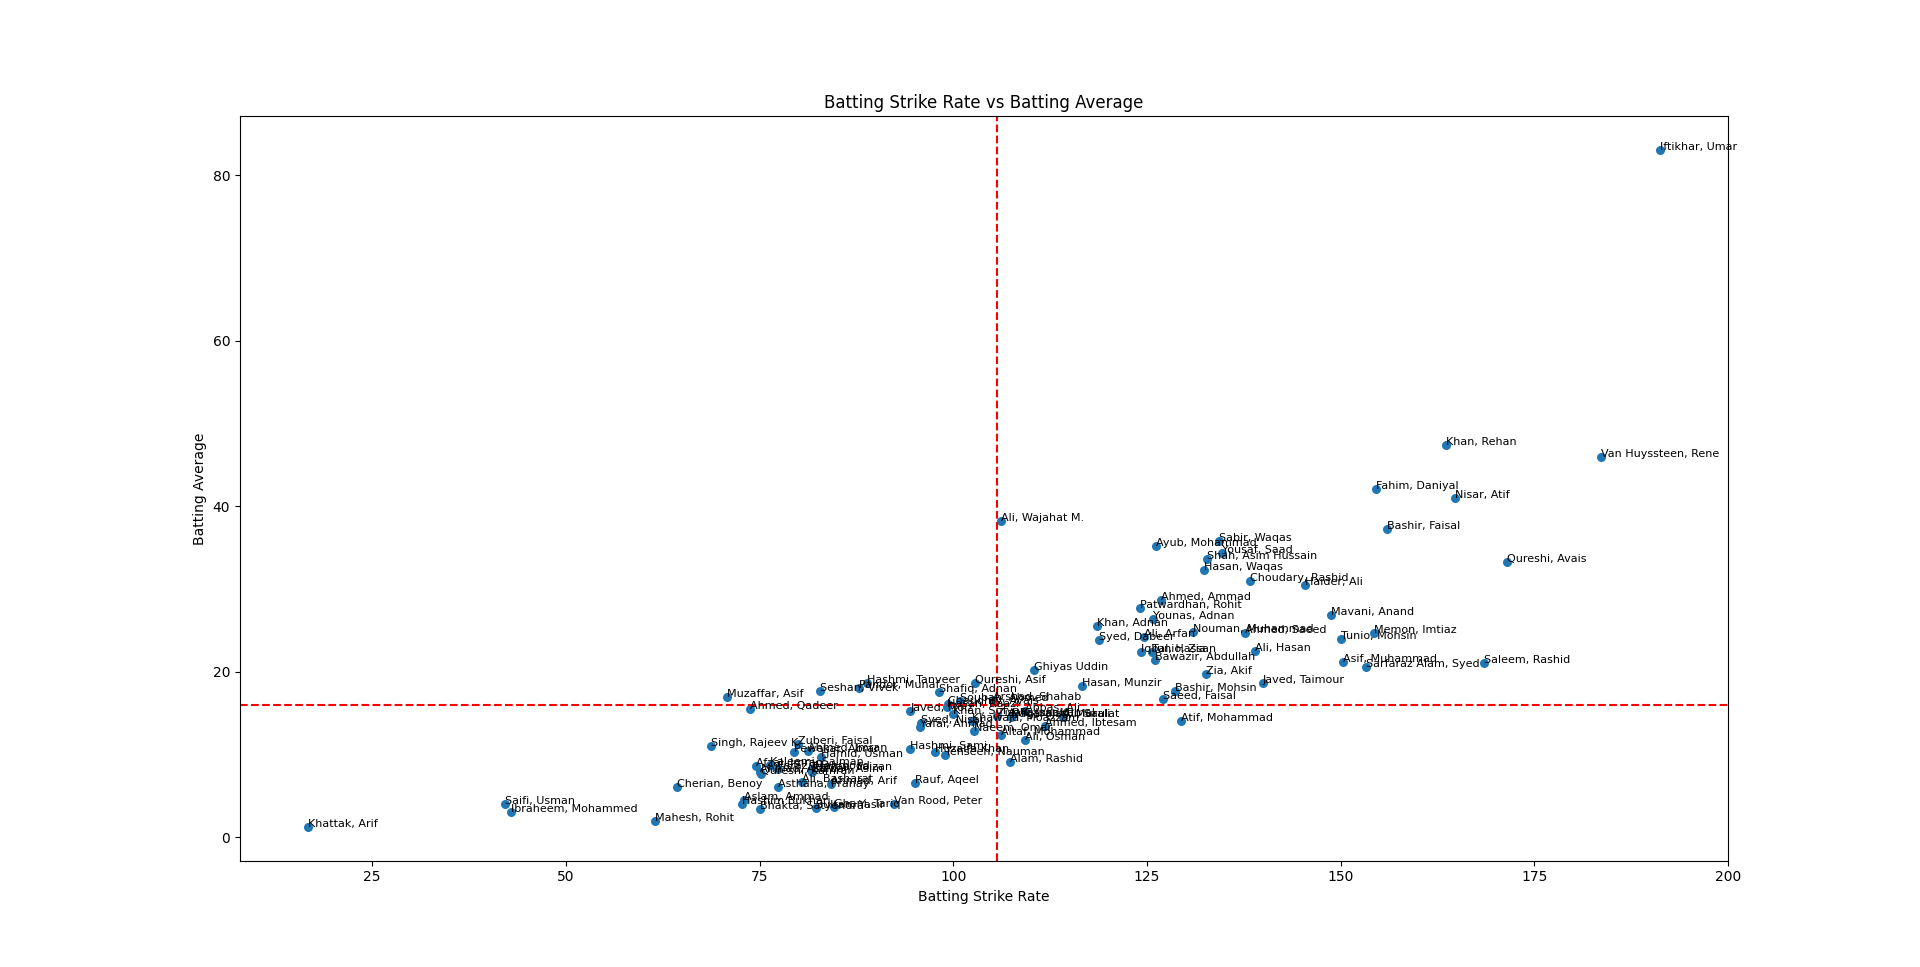
Statistical Analysis: Batting Strike Rate vs. Batting Average
In cricket, the batting strike rate and batting average are two crucial metrics that provide insight into a player’s performance. Analyzing these metrics together through a scatter plot can help us understand the balance between a player’s scoring rate and consistency.
A scatter plot of batting strike rate versus batting average places each player as a point on a graph, where:
- X-Axis (Batting Strike Rate): Represents the rate at which a player scores runs, typically expressed as runs per 100 balls.
- Y-Axis (Batting Average): Represents the average number of runs a player scores per innings.
This plot allows us to:
- Identify High Performers: Players with both high strike rates and high averages stand out as the most impactful.
- Understand Playing Style: Players with high strike rates but lower averages may play aggressively, while those with high averages but lower strike rates might focus on stability and building innings.
- Compare Efficiency and Consistency: The plot helps in assessing which players balance their scoring rate with consistency.
In the attached scatter plot, each dot represents a player’s performance based on their batting strike rate and batting average throughout the season. Notable observations include:
- Top Performers: Players like Iftikhar Umar, with high averages and strike rates, indicate their dominance in the season, scoring quickly while maintaining consistency.
- Efficient Scorers: Players like Rehan Khan and Daniyal Fahim show a good balance of scoring quickly (high strike rate) while maintaining a decent average.
- Stable Batsmen: Players like Nisar Atif and Bashir Faisal have higher averages, indicating their role as anchors, ensuring stability in the innings.
This visual representation helps in quickly identifying the players who have made the most significant impact through their balanced approach between strike rate and average.
For a detailed look at the players’ performances based on this statistical analysis, refer to the attached image of the scatter plot.
Statistical Analysis: Bowling Average vs. Bowling Economy
In cricket, a bowler’s effectiveness is often evaluated through metrics like the bowling average and bowling economy. Analyzing these metrics together provides a comprehensive view of a bowler’s performance, revealing not only how many runs they concede per wicket but also how economical they are in their spells.

A scatter plot of bowling average versus bowling economy places each bowler as a point on a graph, where:
- X-Axis (Bowling Average): Represents the number of runs conceded per wicket taken.
- Y-Axis (Bowling Economy): Represents the number of runs conceded per over bowled.
This plot allows us to:
- Identify Economical Bowlers: Players with lower economy rates (lower Y-axis values) are more economical.
- Assess Wicket-Taking Ability: Players with lower bowling averages (lower X-axis values) take wickets more frequently.
- Compare Efficiency: The ideal quadrant for bowlers is the bottom-left, indicating both low economy rates and low bowling averages.
In the attached scatter plot, each dot represents a bowler’s performance based on their bowling average and economy throughout the season. Notable observations include:
- Top Performers: Bowlers like Hasan Ali, positioned in the bottom-left quadrant, indicate both low runs conceded per wicket and per over, showcasing their efficiency and effectiveness.
- Economical Bowlers: Bowlers with low economy rates, such as Saad Yousaf and Syed Sarfaraz Alam, are crucial in limiting the opposition’s scoring.
- Wicket-Taking Bowlers: Bowlers with low averages, such as Nauman Muhammad and Rohit Patwardhan, are effective in taking wickets frequently, even if their economy might be higher.
For a detailed look at the players’ performances based on this statistical analysis, click on the attached image of the scatter plot.
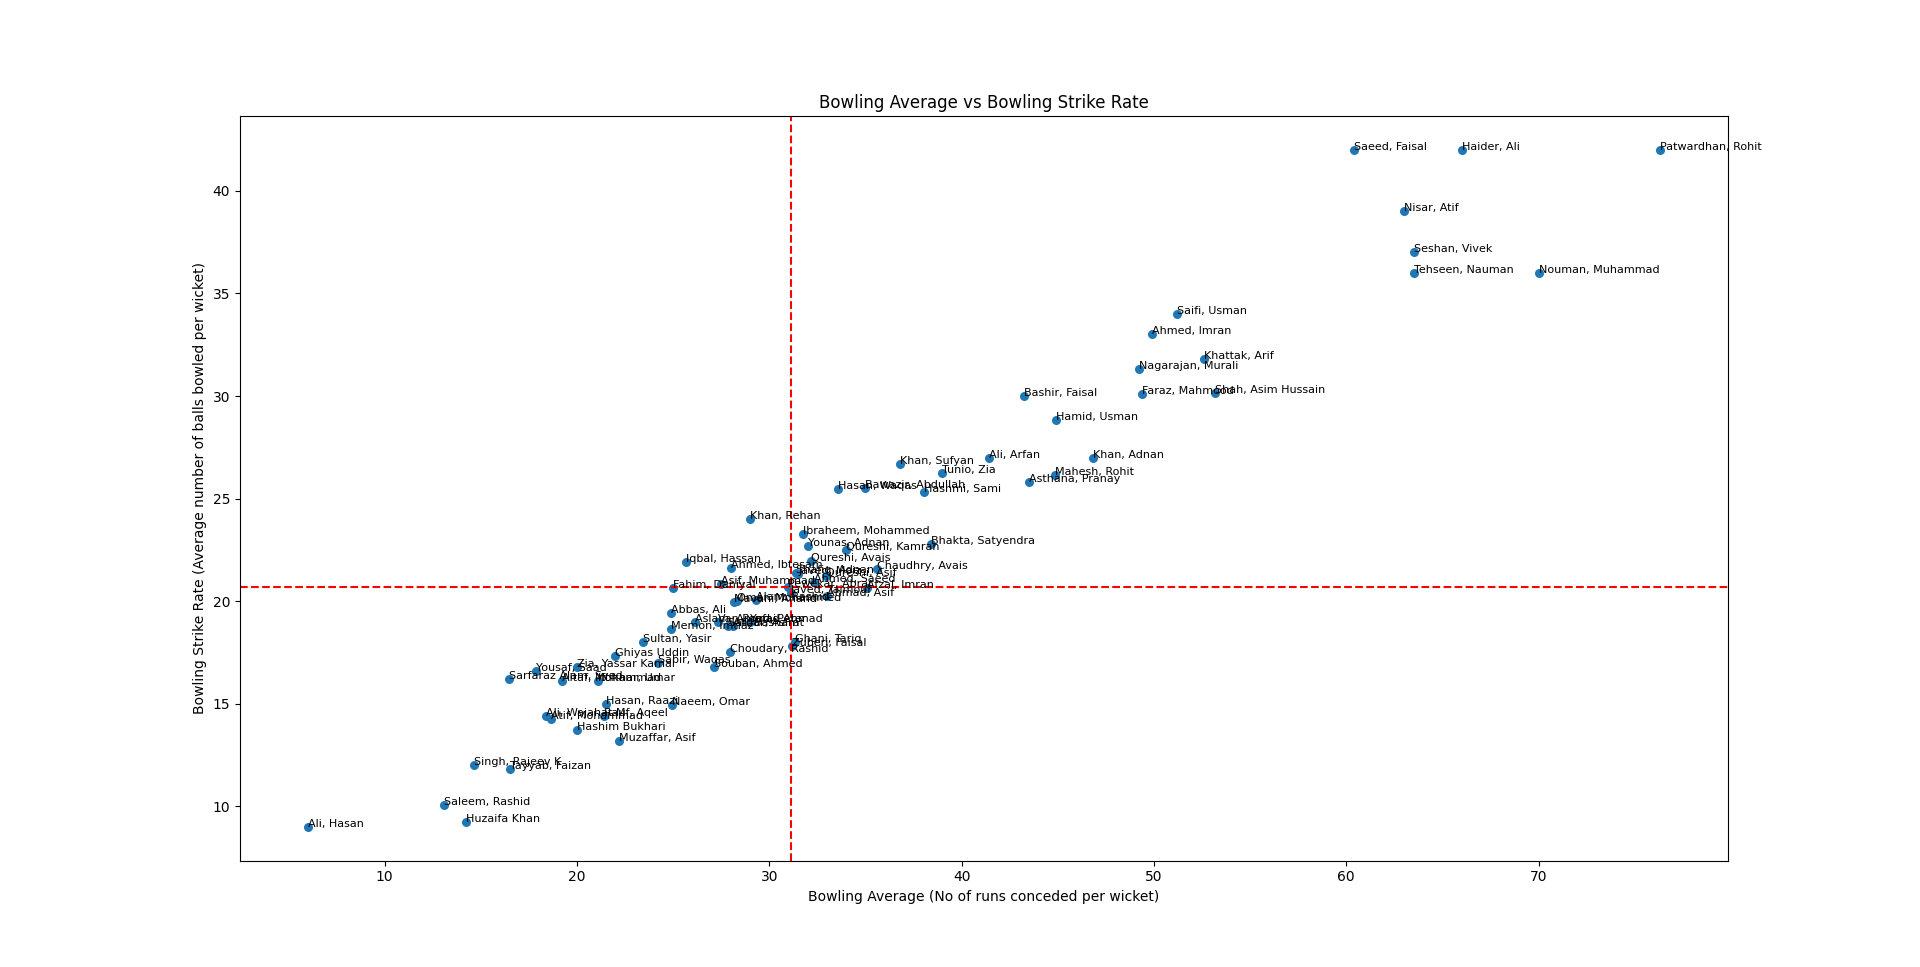
Statistical Analysis: Bowling Average vs. Bowling Strike Rate
In cricket, the bowling average and bowling strike rate are vital metrics that help in evaluating a bowler’s effectiveness. Analyzing these metrics together provides insights into how frequently a bowler takes wickets and how many runs they concede per wicket.
A scatter plot of bowling average versus bowling strike rate places each bowler as a point on a graph, where:
- X-Axis (Bowling Average): Represents the number of runs conceded per wicket taken.
- Y-Axis (Bowling Strike Rate): Represents the average number of balls bowled per wicket taken.
This plot allows us to:
- Identify Wicket-Takers: Players with lower strike rates (lower Y-axis values) take wickets more frequently.
- Assess Economy: Players with lower bowling averages (lower X-axis values) are more economical in terms of runs conceded per wicket.
- Compare Efficiency: The ideal quadrant for bowlers is the bottom-left, indicating both low strike rates and low bowling averages.
In the attached scatter plot, each dot represents a bowler’s performance based on their bowling average and strike rate throughout the season. Notable observations include:
- Top Performers: Bowlers like Hasan Ali, positioned in the bottom-left quadrant, indicate both low runs conceded per wicket and low balls bowled per wicket, showcasing their efficiency and effectiveness.
- Frequent Wicket-Takers: Bowlers with low strike rates, such as Syed Sarfaraz Alam and Saad Yousaf, are crucial for taking wickets quickly.
- Economical Wicket-Takers: Bowlers like Nauman Muhammad and Rohit Patwardhan, who have higher strike rates but lower averages, are effective in maintaining a low economy while taking wickets.
For a detailed look at the players’ performances based on this statistical analysis, click on the attached image of the scatter plot.
Exceptional Performances of the Season
Batters (1000+ Runs)
This season saw several batters achieving exceptional milestones by scoring over 1000 runs. Their consistent performances have been instrumental in their respective teams’ successes.
| # | Name | Matches | NO | Runs | HS | Ave | SR | 100 | 50 | 4s | 6s |
|---|---|---|---|---|---|---|---|---|---|---|---|
| 1 | Iftikhar Umar | 48 | 16 | 2659 | 176* | 83.09 | 191.29 | 6 | 17 | 183 | 155 |
| 2 | Avais Qureshi | 54 | 2 | 1698 | 103 | 33.29 | 171.52 | 1 | 11 | 142 | 111 |
| 3 | Rehan Khan | 45 | 11 | 1566 | 123* | 47.45 | 163.64 | 2 | 11 | 122 | 84 |
| 4 | Daniyal Fahim | 50 | 13 | 1515 | 124 | 42.08 | 154.59 | 1 | 10 | 92 | 75 |
| 5 | Atif Nisar | 42 | 11 | 1272 | 89* | 41.03 | 164.77 | – | 11 | 47 | 92 |
| 6 | Waqas Hasan | 46 | 8 | 1197 | 88 | 32.35 | 132.41 | – | 10 | 62 | 81 |
| 7 | Faisal Bashir | 35 | 3 | 1154 | 101 | 37.23 | 155.95 | 1 | 8 | 95 | 60 |
| 8 | Asim Hussain Shah | 31 | 1 | 1009 | 91* | 33.63 | 132.76 | – | 9 | 60 | 45 |
Bowlers (40+ Wickets)
Several bowlers have shown extraordinary skill by taking over 40 wickets this season. Their contributions have been pivotal in restricting the opposition and securing victories for their teams.
| # | Name | Matches | Overs | Mdns | Runs | Wkts | BBI | Ave | Econ | SR |
|---|---|---|---|---|---|---|---|---|---|---|
| 1 | Saad Yousaf | 47 | 166 | 3 | 1072 | 60 | 4-11 | 17.87 | 6.46 | 16.60 |
| 2 | Syed Sarfaraz Alam | 36 | 126.5 | 1 | 774 | 47 | 4-10 | 16.47 | 6.10 | 16.19 |
| 3 | Mohammad Atif | 35 | 104.3 | – | 821 | 44 | 4-11 | 18.66 | 7.86 | 14.25 |
| 4 | Ali Abbas | 45 | 142.3 | – | 1095 | 44 | 4-19 | 24.89 | 7.68 | 19.43 |
| 5 | Hassan Iqbal | 45 | 160.3 | 2 | 1130 | 44 | 4-17 | 25.68 | 7.04 | 21.89 |
| 6 | Ghiyas Uddin | 35 | 115.4 | 1 | 879 | 40 | 3-22 | 21.98 | 7.60 | 17.35 |
Hat-Tricks
Achieving a hat-trick in cricket is a rare and commendable feat. This season, Faizan Tayyab has demonstrated his exceptional bowling skills by securing a hat-trick.
| # | Name | Date | Opposition | Tournament | O-M-R-W |
|---|---|---|---|---|---|
| 1 | Faizan Tayyab | 03-Nov-2023 | Dhahran Flames | DPL2324 | 4-0-30-3 |
These players have showcased extraordinary talent and consistency, making significant contributions to their teams’ performances throughout the season. Their achievements highlight the competitive spirit and high skill level present in the DCA Dhahran Cricket Association.
Captain’s Success Rates
Leadership plays a pivotal role in cricket, and the captains of DCA teams have displayed remarkable strategic acumen and motivation to lead their teams to success. Below are the detailed statistics of the captains’ performances throughout the season, sorted by their win percentage.
| # | Name | Club | Matches | NR/Dr | Lost | WIN% | Wins |
|---|---|---|---|---|---|---|---|
| 1 | Khan, Rehan | DCA | 13 | – | 2 | 84.62 | 11 |
| 2 | Qureshi, Avais | DCA | 30 | – | 8 | 73.33 | 22 |
| 3 | Fahim, Daniyal | DCA | 31 | – | 10 | 67.74 | 21 |
| 4 | Ali, Basharat | DCA | 31 | – | 12 | 61.29 | 19 |
| 5 | Ahmad, Asif | DCA | 25 | 1 | 16 | 32.00 | 8 |
| 6 | Hasan, Waqas | DCA | 29 | 1 | 20 | 27.59 | 8 |
Summary:
- Rehan Khan showcased exceptional leadership with an impressive win rate of 84.62% from 13 matches.
- Avais Qureshi led his team to 22 wins out of 30 matches with a winning percentage of 73.33%.
- Daniyal Fahim achieved 21 wins in 31 matches, maintaining a win rate of 67.74%.
- Basharat Ali secured 19 victories in 31 matches, resulting in a win percentage of 61.29%.
- Despite facing challenges, Asif Ahmad and Waqas Hasan managed to secure 8 wins each in their respective matches.
These captains have demonstrated exceptional leadership and strategic acumen, contributing significantly to their teams’ performances throughout the season.
Consistent Bowlers: Multiple 3-Wicket Hauls
This season, several bowlers have shown remarkable consistency by taking three or more wickets on multiple occasions. Below are the detailed statistics of these standout performers who have significantly contributed to their teams’ successes.
| Player | Matches | Overs | Mdns | Bowling Runs | Wickets | Best Bowling | 3-Wicket Hauls |
|---|---|---|---|---|---|---|---|
| Atif Mohammad | 35 | 104.3 | 0 | 821 | 44 | 4-11 | 6 |
| Sarfaraz Alam, Syed | 36 | 126.5 | 1 | 774 | 47 | 4-10 | 5 |
| Mohammad Altaf | 29 | 96.4 | 0 | 693 | 36 | 4-23 | 5 |
| Yousaf Saad | 47 | 166.0 | 3 | 1072 | 60 | 4-11 | 4 |
| Abbas Ali | 45 | 142.3 | 0 | 1095 | 44 | 4-19 | 4 |
| Iqbal Hassan | 45 | 160.3 | 2 | 1130 | 44 | 4-17 | 4 |
| Mavani Anand | 27 | 99.5 | 0 | 845 | 30 | 3-27 | 4 |
| Souban Ahmed | 47 | 83.5 | 0 | 814 | 30 | 3-22 | 4 |
| Tayyab Faizan | 13 | 39.2 | 0 | 330 | 20 | 4-23 | 4 |
| Ghiyas Uddin | 35 | 115.4 | 1 | 879 | 40 | 3-22 | 3 |
| Iftikhar Umar | 48 | 94.0 | 0 | 739 | 35 | 3-19 | 3 |
| Javed Moiz | 36 | 106.4 | 0 | 945 | 30 | 3-21 | 3 |
| Rauf Aqeel | 15 | 43.1 | 0 | 385 | 18 | 4-18 | 3 |
This table highlights bowlers who have taken three or more wickets on multiple occasions. Their consistent performances have been pivotal in their teams’ successes throughout the season. The detailed statistics showcase their ability to perform under pressure and contribute significantly in various matches.
Conclusion
As the 2023-2024 season comes to a close, the Dhahran Cricket Association can look back on a year of outstanding achievements and remarkable performances. From record-breaking individual feats to strategic leadership that led teams to victory, this season has truly showcased the talent and dedication of all participants. We look forward to building on this success in the coming seasons. For a detailed look at all statistics and performances, visit our main stats website.
